Introduction to CareKit, Part 2: Insights
Troy Tsubota • 05 January 2017
Welcome to part 2 of the Introduction to CareKit tutorial. This second part of the tutorial will continue to give an overview of Apple’s CareKit framework.
In Part 1, you learned what CareKit is and used three modules: the Care Card, Symptom and Measurement Tracker, and Care Plan Store.
In this part, you’ll use a fourth module, Insights, to use the care data to display user-friendly text and charts to the user.
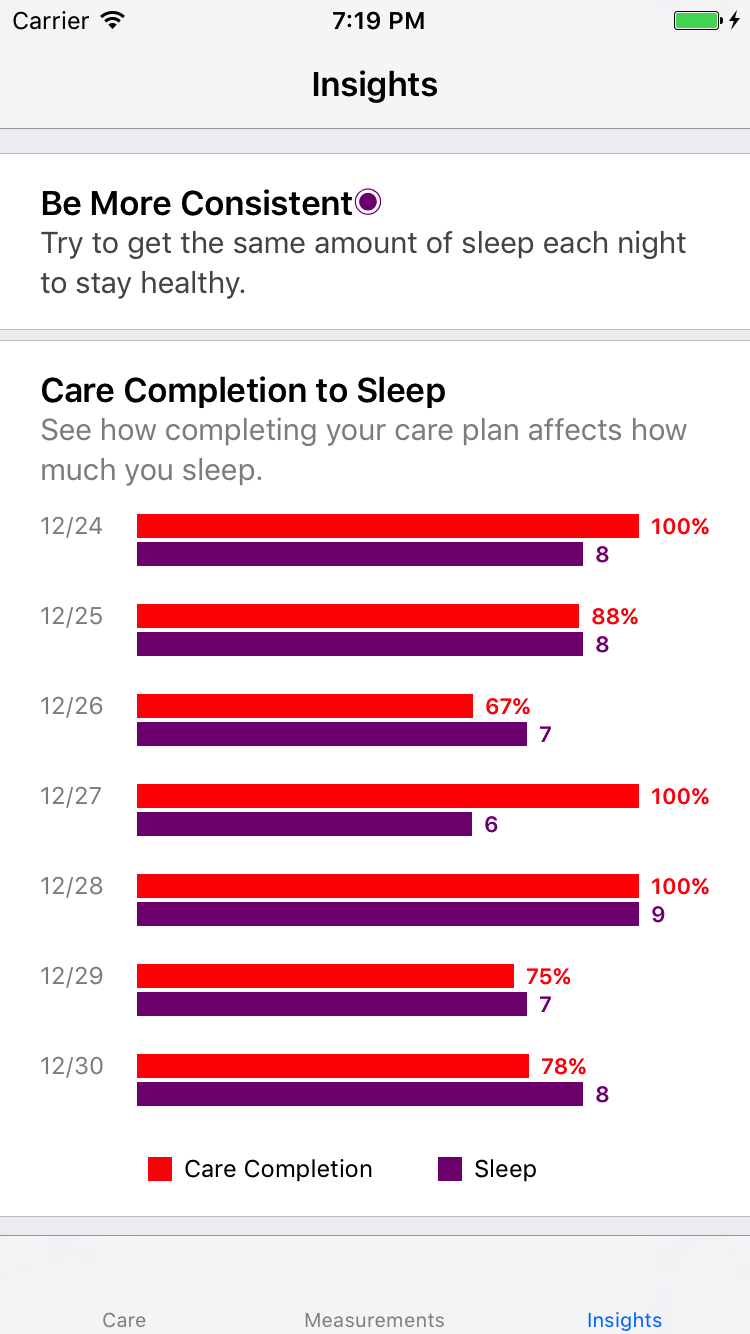
Insights you'll be building in this tutorial
Prerequisites
Some knowledge of Grand Central Dispatch will be helpful, although not necessary, to understand this tutorial. You can read about it here.
Setup
Open your HelloCareKit project from the Part 1. If you haven’t completed Part 1, download the finished project from that part on GitHub.
To start, define a calendar property below activityStartDate:
let calendar = Calendar(identifier: .gregorian)
This is simply a convenience property to perform various date operations.
Next, define some properties for Insights:
var insights: OCKInsightsViewController!
var insightItems = [OCKInsightItem]() {
    didSet {
        insights.items = insightItems
    }
}
The insights property is for the view controller. This is the only view controller that we’ll be storing as a property since we directly modify it with insightItems. insightItems sets the items on insights every time it gets set.
You’ll then need to create a method that determines which items to add to insightItems:
func updateInsights() {

}
You’ll fill updateInsights out later on in the tutorial.
In viewDidLoad, add this after creating the symptom tracker:
insights = OCKInsightsViewController(insightItems: insightItems)
insights.title = "Insights"
updateInsights()
This simply creates an OCKInsightsViewController, passing in the insight items you created earlier.
Finally, where you set the viewControllers, add this to the array:
UINavigationController(rootViewController: insights)
Build and run to see Insights in the third tab of your app.
Insights
It probably won’t be very long until you get bored of staring at a blank Insights screen. Back to Xcode!
OCKCarePlanStoreDelegate
An object conforming to the OCKCarePlanStoreDelegate protocol can listen to changes in the care plan store. The two methods of the protocol are as follows:
carePlanStore(_ store:, didReceiveUpdateOf:)is called every time a single event changes.carePlanStoreActivityListDidChange(_ store:)is called every time the activities change.
It looks like carePlanStore(_ store:, didReceiveUpdateOf:) would be useful for Insights. Make the tab bar controller conform to OCKCarePlanStoreDelegate by adding an extension:
extension TabBarController: OCKCarePlanStoreDelegate {

}
Then add the following to the extension body:
func carePlanStore(_ store: OCKCarePlanStore, didReceiveUpdateOf event: OCKCarePlanEvent) {
    updateInsights()
}
All this does is call updateInsights() every time an event changes, whether a circle becomes filled in or an assessment is completed. More fine-grained handling can be done by using the event parameter, but that isn’t necessary for this tutorial.
Make sure you set the store’s delegate in the carePlanStore instantiation closure:
// lazy var carePlanStore

let store = OCKCarePlanStore(persistenceDirectoryURL: url)
store.delegate = self
return store
Fetching Events
There are two types of items you can display in Insights, each of which have two representations:
- Messages, of type
OCKMessageItem, are simple text items to explain what the user’s care data means.- Alerts are for telling the user something important.
- Tips are for giving the user helpful suggestions.
- Charts, of type
OCKChart, are graphical representations of care data.- Bar Charts come with CareKit. They can have multiple series and compare various sets of data at once.
- Custom Charts can be nearly anything. They just need to subclass
OCKChartand overridechartView()to display a custom view.
In this tutorial, you’ll be making two items:
- A dynamic message to either alert the user of bad sleep habits or to tell the user to keep it up with a tip.
- A bar chart to compare sleeping to completing interventions.
In order to display the items, you first need to fetch the events of the activities to get the data you need. Here, we define a helper method for fetching the sleep events:
func fetchSleep(completion: @escaping ([DateComponents: Int]) -> ()) {
    var sleep = [DateComponents: Int]()

    let sleepStartDate = calendar.dateComponents([.year, .month, .day], from: calendar.date(byAdding: DateComponents(day: -7), to: today)!)
    let sleepEndDate = calendar.dateComponents([.year, .month, .day], from: calendar.date(byAdding: DateComponents(day: -1), to: today)!)

    carePlanStore.activity(forIdentifier: "sleep") { [unowned self] (_, activity, error) in
        if let error = error {
            print(error.localizedDescription)
        }
        guard let sleepAssessment = activity else { return }
        self.carePlanStore.enumerateEvents(of: sleepAssessment, startDate: sleepStartDate, endDate: sleepEndDate, handler: { (event, _) in
            guard let event = event else { return }
            if let result = event.result {
                sleep[event.date] = Int(result.valueString)!
            } else {
                sleep[event.date] = 0
            }
        }, completion: { (_, error) in
            if let error = error {
                print(error.localizedDescription)
            }
            completion(sleep)
        })
    }
}
This might seem daunting, so let’s break it down:
- The method signature may seem a little odd.
completionis a closure that takes a dictionary of[DateComponents: Int]and returns nothing. Because of how concurrent programming works, you have to return a completion handler with the return value passed in as a parameter.@escapingis used to show that the completion handler will be called to exit the method. - You define a variable
sleep, a dictionary of[DateComponents: Int]. The key (DateComponents) is the date of the event, and the value (Int) is the number of hours slept. sleepStartDateandsleepStartDatespecify the range of days to check for events. Each day will have one entry in thesleepdictionary. These represent a week from today to yesterday.- You then fetch the sleep activity from the care plan store. You check if there’s an error and if the returned activity exists.
- You then go through all the sleep events between
startDateandendDateusingenumerateEvents(of:, startDate:, endDate:, handler:, completion:).handleris called for each event, andcompletionis called at the end. - Going through each event, you add the result as an integer to the dictionary, with the key as the date of the event. If there is no result, you set the value to 0.
- In the completion handler, you check if there’s an error. Finally, you call the completion handler of the
fetchSleep, passing insleepas the dictionary.
Next, you’ll define a method for retrieving the percent of interventions completed for each day:
func fetchInterventionCompletion(completion: @escaping ([DateComponents: Int]) -> ()) {
    var interventionCompletion = [DateComponents: Int]()

    let interventionStartDate = calendar.dateComponents([.year, .month, .day], from: calendar.date(byAdding: DateComponents(day: -7), to: today)!)
    let interventionEndDate = calendar.dateComponents([.year, .month, .day], from: calendar.date(byAdding: DateComponents(day: -1), to: today)!)

    carePlanStore.dailyCompletionStatus(with: .intervention, startDate: interventionStartDate, endDate: interventionEndDate, handler: { (date, completed, total) in
        interventionCompletion[date] = lround((Double(completed) / Double(total)) * 100)
    }, completion: { (_, error) in
        if let error = error {
            print(error.localizedDescription)
        }
        completion(interventionCompletion)
    })
}
This method is very similar to fetchSleep:
- The same method signature is used.
- The dictionary,
interventionCompletion, has the same form as thesleepdictionary from earlier. This time, however, theIntrepresents a whole number to represent a percent. For example,67would be passed through if 67% of the interventions were completed. - The start date and end date are the same as
fetchSleep. - CareKit conveniently provides a method on
OCKCarePlanStorenameddailyCompletionStatus(with:, startDate:, endDate:, handler:, completion:). You provide a type of activity (either intervention or activity), and everything else is very similar toenumerateEvents(of:, startDate:, endDate:, handler:, completion:). - For every day, you add an entry to
interventionCompletion. You take the number of events completed and divide it by the total number of events for that day to get the percent completed. You then multiply the percent by 100 and round it to get a whole number representation. - The completion handler is implemented like
fetchSleep.
Using the Data
With the fetching of the care data implemented, you now need methods to create insight items for it.
Sleep Message
Define a method for creating the sleep message:
func sleepMessage(sleep: [DateComponents: Int]) -> OCKMessageItem? {

}
This method takes a dictionary, which will be the same one returned from fetchSleep.
Add the following to the method body:
let sleepAverage = Double(sleep.values.reduce(0) { $0 + $1 }) / Double(sleep.count)
let sleepAverageInt = lround(sleepAverage)
This defines two constants: sleepAverage and sleepAverageInt. sleepAverage is calculated by adding up all the values of sleep and dividing it by the number of entries. sleepAverageInt rounds that average to a whole number of hours for display.
Finally, determine which message to display, create it, and return it:
if sleepAverage < 6 {
let averageAlert = OCKMessageItem(title: "Sleep More", text: "You only got an average of \(sleepAverageInt) hours of sleep this week.", tintColor: .purple, messageType: .alert)
return averageAlert
} else if sleep.values.max()! - sleep.values.min()! >= 3 {
let consistentAlert = OCKMessageItem(title: "Be More Consistent", text: "Try to get the same amount of sleep each night to stay healthy.", tintColor: .purple, messageType: .alert)
return consistentAlert
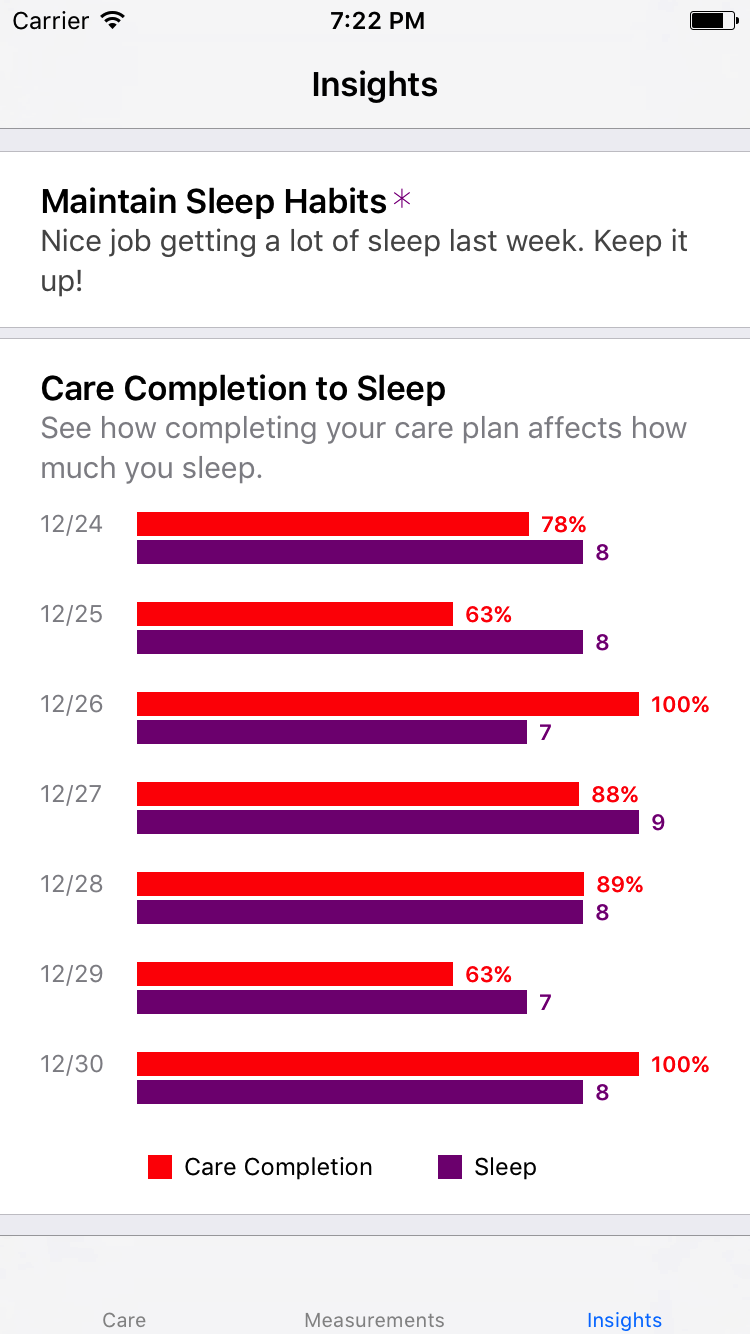
} else if sleepAverage > 7.5 {
let averageTip = OCKMessageItem(title: "Maintain Sleep Habits", text: "Nice job getting a lot of sleep last week. Keep it up!", tintColor: .purple, messageType: .tip)
return averageTip
}
return nil
The conditions are as follows:
- If the average amount of sleep the user got is less than 6 hours, you create an alert telling the user to sleep more.
- If the difference between the user’s greatest sleep and the user’s least sleep is 3 hours or more, you create an alert telling the user to be consistent.
- If the average amount of sleep the user got it greater than 7.5 hours, you create a tip telling the user they did a nice job getting sleep and to keep it up.
- If none of the conditions are fulfilled, it means the user did a satisfactory job and nothing will be shown.
Intervention Bar Chart
The bar chart will be comprised of three parts: axis titles (dates), an intervention completion series, and a sleep series.
Create a property for the date formatter for the axis titles:
lazy var monthDayFormatter: DateFormatter = {
    let formatter = DateFormatter()
    formatter.dateFormat = "MM/dd"
    return formatter
}()
This is a lazily instantiated date formatter that takes dates and outputs strings like “06/24” or “11/18”.
Next, create a method for making a bar chart:
func interventionBarChart(interventionCompletion: [DateComponents: Int], sleep: [DateComponents: Int]) -> OCKBarChart {

}
This method takes two parameters: one for intervention completion and another for sleep. Both will be from the fetching methods you created earlier.
Add this to the body of the method:
let sortedDates = interventionCompletion.keys.sorted() {
    calendar.dateComponents([.second], from: $0, to: $1).second! > 0
}
let formattedDates = sortedDates.map {
    monthDayFormatter.string(from: calendar.date(from: $0)!)
}
sortedDates are the dates in the keys of the dictionaries (the dates will be the same in both) sorted from earliest to latest. formattedDates maps those dates to a string representation using the formatter you created earlier.
With this, you can create the bar series for intervention completion:
let interventionValues = sortedDates.map { interventionCompletion[$0]! }
let interventionSeries = OCKBarSeries(title: "Care Completion", values: interventionValues as [NSNumber], valueLabels: interventionValues.map { "\($0)%" }, tintColor: .red)
interventionValues is a sorted array (earliest to latest date) of all the percents of intervention completion. Those are then passed into interventionSeries. The valueLabels just use the values and append “%” to them.
Then, create the sleep bar series:
let sleepNumbers = sortedDates.map { sleep[$0]! }
let sleepValues: [Double]
if sleep.values.max()! > 0 {
    let singleHourWidth = 100.0 / Double(sleep.values.max()!)
    sleepValues = sleepNumbers.map { singleHourWidth * Double($0) }
} else {
    sleepValues = sleepNumbers.map { _ in 0 }
}
let sleepSeries = OCKBarSeries(title: "Sleep", values: sleepValues as [NSNumber], valueLabels: sleepNumbers.map { "\($0)" }, tintColor: .purple)
sleepNumbers uses the same dates to get all the sleep numbers, sorted.
Because of how CareKit charts are designed, you’ll usually have to manipulate one of the series to make them evenly aligned, since the bar width is calculated between both series.
For example, if the user completed 90% of their interventions and got 8 hours of sleep, the chart will look skewed as the 8 compared to the 90 will look much smaller.
To fix this issue, you have to manipulate the values of the sleep series and match them to the intervention series.
What you first do here is divide 100 by the maximum hours of sleep to get the value of a single hour. You then go through each sleep number and multiply that by the single hour value to get a sleep value. However, if the maximum number of hours is 0, then all the sleepValues will be 0 (to avoid dividing by 0).
On the other hand, the valueLabels, which are displayed to the user, are still the sleepNumbers.
Finally, create the bar chart:
let interventionBarChart = OCKBarChart(title: "Care Completion to Sleep", text: "See how completing your care plan affects how much you sleep.", tintColor: nil, axisTitles: formattedDates, axisSubtitles: nil, dataSeries: [interventionSeries, sleepSeries], minimumScaleRangeValue: 0, maximumScaleRangeValue: 100)
return interventionBarChart
This creates an OCKBarChart, passing in the axis titles as the formatted dates, the series as the two series you created, and the minimum and maximum values of 0 and 100.
Putting it All Together
With all the care data fetching and displaying methods complete, you can now create logic to combine them.
Add this to updateInsights:
self.insightItems = []

var sleep = [DateComponents: Int]()
var interventionCompletion = [DateComponents: Int]()
The insight items are cleared to prevent duplicate insights (which can happen, unlike the care plan store). You also define the sleep and interventionCompletion variables you’ve seen throughout this tutorial.
Next, add the following:
let activitiesDispatchGroup = DispatchGroup()

activitiesDispatchGroup.enter()
fetchSleep { sleepDict in
    sleep = sleepDict
    activitiesDispatchGroup.leave()
}

activitiesDispatchGroup.enter()
fetchInterventionCompletion { interventionCompletionDict in
    interventionCompletion = interventionCompletionDict
    activitiesDispatchGroup.leave()
}
Here, we fetch the sleep and intervention completion dictionaries from the methods we created earlier. In order to sync them up to create the chart, we use a dispatch group.
Finally, add this to the method:
activitiesDispatchGroup.notify(queue: .main) {
    if let sleepMessage = self.sleepMessage(sleep: sleep) {
        self.insightItems.append(sleepMessage)
    }
    self.insightItems.append(self.interventionBarChart(interventionCompletion: interventionCompletion, sleep: sleep))
}
After fetching the data, we use the methods you created earlier to use the data and create the message and bar chart. Because sleepMessage can return nil, that is wrapped in an if let statement. The items are appended to insightItems.
Finally, after lots of code (and math), build and run to see your complete Insights view controller.
Insights with the message and chart
What’s next?
In this part of the tutorial, you learned how to:
- Use the Insights module.
- Implement the care plan store delegate.
- Fetch events from the care plan store.
- Display messages and charts in Insights.
You can download the finished project from this part on GitHub.
In Introduction to CareKit, Part 3, you’ll explore the final two CareKit modules, Connect and Document Exporter.
If you have any questions, feedback, or tutorial requests, feel free to open an issue on GitHub. I hope you enjoyed this tutorial!